
Case Study 05 / RevOps
From a manual dashboard check to a daily engagement intelligence system
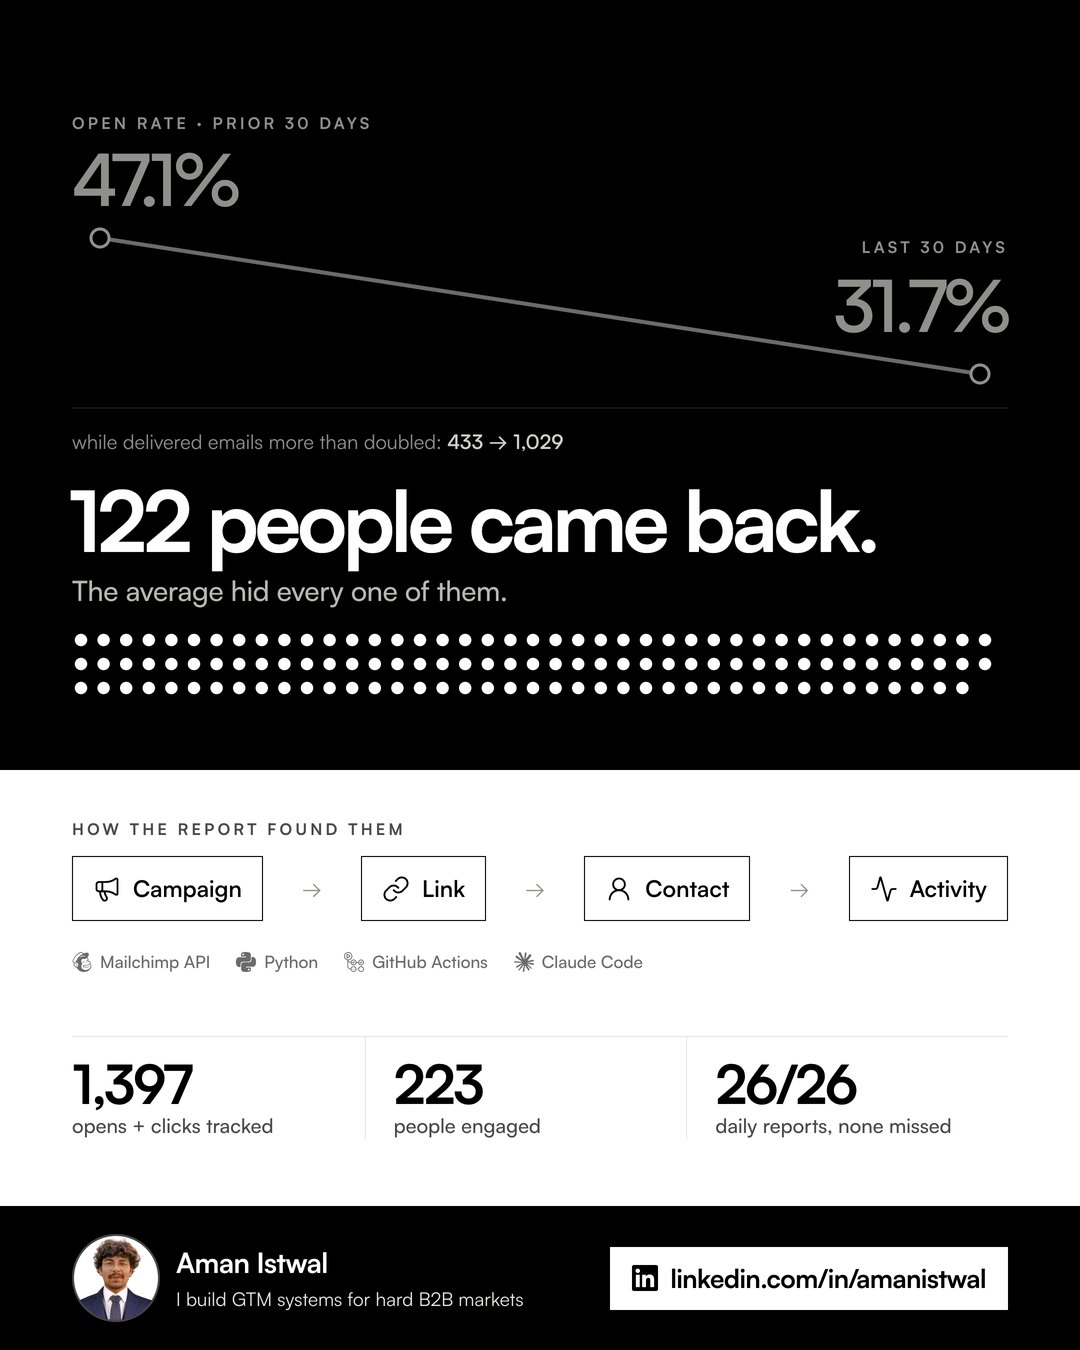
Over 30 days the open rate fell from 47.1% to 31.7%. On a dashboard that's a bad month. The report underneath it named 122 people who had come back for two or more emails. That report comes from a system that replaced a manual Mailchimp dashboard check: since going live on 18 September 2026 it has delivered 26 of 26 daily reports with nobody touching it and tied 1,397 opens and clicks to 223 people.
- people who came back for 2+ emails
- 122
- open rate, as delivered emails more than doubled
- 47.1% → 31.7%
- opens and clicks tied to a named person
- 1,397
- daily reports delivered unattended since 18 Sep
- 26/26
The Insight
The average fell. The people didn't.
In the 30 days to 12 October 2026 the open rate dropped from 47.1% to 31.7%. In the same period delivered emails more than doubled, from 433 to 1,029. New, colder contacts pull an average down; that's arithmetic, not a crisis.
A dashboard shows only the average, so it reads as a bad month. The engagement report showed what sat underneath: 122 people engaged with two or more emails, each with the links they chose and when.
In a market of a few hundred accounts, those names are the report. Every one is someone to call, not a rate to improve. The rest of this case study is how the system that finds them was built.
Founder track record: this work was led by Clarafold's founder before founding Clarafold, while working as marketing manager at a maritime compliance software company. The client's name is withheld until it approves publication; every figure comes from its own systems. Clarafold client engagements are added as they complete.
01 · Client
Maritime compliance software company
Maritime compliance software and services company running regular newsletter and nurture campaigns. Name withheld until the client approves publication.
The challenge
The team ran a real B2B email program: newsletters, campaigns, tracked links and a growing audience. Reporting meant logging into Mailchimp, exporting to Excel, comparing against earlier campaigns by memory, building charts and writing up what was worth telling the founders. It worked only on days when someone had the time, and it stayed at campaign level: open rate, click rate, bounces. The questions that matter for GTM went unanswered: which link earned the click, who clicked it, how many times, and whether that person had engaged before. The problem wasn't a lack of data. It was the distance between the data and the GTM decision.
02 · System
What existed before.
- Manual dashboard checks, Excel exports and screenshots
- Campaign-level averages only: no view of which link, which person or which repeat visitor
- Comparisons made from memory, so every report started from scratch
- A report that existed only on the days someone had time to build it
03 · Intervention
What was built and run.
Scoped narrowly on purpose
Automate the daily report first. Don't touch the working newsletter integration, don't build a CRM or a data warehouse, don't invent lead scores. The design question was: what is the smallest reliable system that turns raw email activity into founder-level intelligence?
Gated every phase
21 phases, each run as audit → propose → approve → build → verify, with Claude Code as the AI pair-engineer. No phase wrote code before the previous one was reviewed, and the architecture came from the GTM questions the report had to answer, not from the tools.
Modelled engagement in four layers
Campaign (what happened, against what baseline), link (which content earned attention), contact (who clicked, how many times, first and last click) and activity (a de-duplicated timeline per person across campaigns). One activity call per campaign keeps API usage flat as the list grows.
Fixed the data before adding AI
No AI lead scores and no predicted intent. Engagement patterns are transparent, rule-based categories, so anyone can see why a contact sits where it does. Asking AI to interpret unreliable data only makes it wrong with more confidence.
Built a safety layer
A test mode that builds the whole report without sending it, a recipient check that blocks sends to an empty list, calculations that survive zero-delivery campaigns, anomaly flags that surface impossible numbers instead of hiding them, and a log of every step from API call to delivery.
Shipped it to run unattended
Validated on a local schedule, then moved to GitHub Actions: every morning at 09:00 IST it pulls the data, renders charts, an HTML report and a PDF, and emails them. Engagement history is committed back to the repository on each run, so it builds up over time with no database and no server.
Inside The System
How it works.
Who clicked what
Take a newsletter with five links: the article, a video, a guide download, the product page and a demo booking. A campaign report says it earned 40 clicks. This report breaks every link down into its unique clickers, total clicks, first and last click, the other links each person clicked and the other campaigns they engaged with. That's the view a GTM team actually plans from.
Behaviour, not guessed intent
One contact opens at 09:14, reads the article at 09:18, visits the product page twice and clicks to book a demo before lunch. The system records that timeline exactly. It does not conclude the contact is ready to buy. Behaviour is data; intent is an interpretation, and that stays with a person.
Two speeds of reporting
The daily email is the executive layer: what happened, what changed, where engagement happened, who engaged and anything unusual, readable in a minute. The HTML and PDF report is the intelligence layer: which campaign, which link, which contact, how many times, when, and whether they've engaged before.
The number that looked wrong
One campaign showed 401 unique clicks from 346 delivered emails: a 115.9% click rate. Capping it at 100% would have looked fine and stayed wrong. Tracing the field back to Mailchimp's API schema showed it counts unique clicks per link, summed across links, not people. The people-level field gave the real figure, 13.9%. The link-level number was kept and relabelled, and a regression test pinned to 346 / 401 stops the error from shipping again.
Where automation actually broke
Not in the Python. PDF rendering needed system libraries the CI runner didn't have, repository permissions blocked the first state commits, and scheduled triggers didn't always fire on the minute. Rather than add an external scheduler, the system was watched in production. Several days of clean, unattended runs showed the extra infrastructure wasn't needed.
The daily run
04 · Outcome
What changed.
26 of 26 daily reports delivered between 18 September and 12 October 2026. Every run completed without anyone opening a dashboard or a laptop.
Contact-level history across campaigns: 1,397 opens and clicks tied to 223 people at 158 companies across four tracked campaigns, with internal, test and bounced contacts excluded. Each person has a first and last click and the exact links they chose.
Names instead of averages: when the open rate fell from 47.1% to 31.7% as the list doubled, the report surfaced the 122 people who came back for two or more emails, so the team acts on people rather than on the rate.
A measurement error caught before it reached the CEO: the 115.9% click rate above, corrected to 13.9% and locked down with a regression test.
05 · Lessons
What we would tell you.
- Never clamp a number you don't understand. A capped 100% would have looked fine and stayed wrong.
- Behaviour is data. Intent is an interpretation. Report what people did; leave the judgement about readiness to a person.
- Get the data right before adding AI. Otherwise AI just interprets questionable numbers more confidently.
- Small, approved phases ship faster than one big build. Each phase was easy to review, and the clean foundation made the second-stage upgrade an extension rather than a rewrite.
- Don't add infrastructure because a system might fail. Watch where it actually fails first.
- Automation isn't automation until it runs when your laptop is closed.
Put It To Work